


With the advancement of satellite navigation technology, an increasing number of positioning and navigation products have emerged in the market. The quality of raw GNSS data (observation and ephemeris data) is crucial, as it directly affects high-precision positioning accuracy. Data quality not only reflects product performance but also determines data processing strategies. As the core of GNSS-based positioning, navigation, and timing (PNT) services, the quality of observation data directly impacts PNT performance. This article focuses on the role and application value of data completeness rate and cycle slip ratio in GNSS data quality assessment.
Data Completeness Rate
1. Definition
The GNSS data completeness rate refers to the ratio between the actual valid observation data received by a GNSS receiver within a given time period and the theoretical data that should have been received. It typically includes the following aspects:
Temporal Integrity: Continuity of data over time, i.e., whether there are any data gaps or interruptions.
Spatial Integrity: Coverage of data across space, i.e., whether signals from all available satellites are effectively received.
Signal Integrity: Whether the received signals are complete, and whether there is any signal attenuation or interference.
At each epoch, a GNSS device records multiple satellite observations, including pseudorange, carrier phase, Doppler shift, and signal-to-noise ratio (SNR). Additionally, it must obtain corresponding ephemeris data to calculate satellite positions. If data from certain epochs are missing, incomplete, or affected by signal blockages or interference, they are considered "lost data," which negatively impacts the overall data completeness rate.
2. Evaluation Method
The evaluation involves analyzing raw data files in RINEX format. By comparing the theoretical epoch timestamps with the actual observation data, we can determine whether there are any missing epochs. Epochs with a signal-to-noise ratio (SNR) below a defined threshold are flagged as invalid. Additionally, carrier phase continuity checks are used to identify abnormal epochs and detect cycle slips or loss of lock events.
Commonly used tools for RINEX data analysis include TEQC, RTKLIB, and custom Python scripts tailored for specific processing needs.
In addition to statistical analysis of data collected in static scenarios, it is also necessary to assess the system’s sensitivity to data interruptions under dynamic conditions. This includes testing in environments with signal blockage, multipath interference, low device battery, high temperature, and other extreme scenarios to evaluate how data completeness is affected.
3. Key Metrics
Epoch Loss Rate: This is a direct indicator of data integrity, quantifying the proportion of missing or invalid epochs relative to the total number of expected epochs. Under high sampling rates, special attention should be paid to brief interruptions, as even short outages can result in a large number of lost epochs.
Duration of Data Gaps: This refers to the length of time a single data interruption lasts. It is particularly important for dynamic applications, where prolonged gaps may cause positioning failure or degradation in accuracy. Interruptions exceeding 30 seconds can significantly affect RTK initialization, while those longer than 5 minutes may lead to re-convergence in PPP solutions.
Multi-GNSS system Redundancy: This involves comparative analysis of data completeness across multiple GNSS constellations such as GPS, BDS, and Galileo. When one system (e.g., GPS) shows lower data completeness, the ability of other systems (e.g., BDS) to compensate becomes crucial in maintaining observation reliability, especially in challenging environments.
4. Factors Affecting Data Completeness
1) Signal Obstruction: Physical obstacles such as tall buildings, trees, or mountains can block satellite signals, resulting in data loss. This issue is particularly pronounced in urban canyons or complex terrain environments.
2) Multipath Effects: Reflected signals reaching the GNSS device can interfere with direct signals, leading to measurement errors or even data loss.
3) Ionospheric and Tropospheric Delays: Signal propagation can be disrupted by atmospheric conditions, especially during periods of high solar activity, potentially leading to incomplete or inaccurate data.
4) GNSS Device Performance: The quality of the antenna design, signal processing capability, and resistance to interference all play a critical role in ensuring consistent and complete data collection.
5) GNSS System-Related Factors: These include the number and spatial geometry of visible satellites (as indicated by PDOP values), the use of single-frequency vs. multi-frequency signals (with multi-frequency generally offering better resilience to interference), and the configured data sampling rate (where higher rates may increase the risk of data gaps).
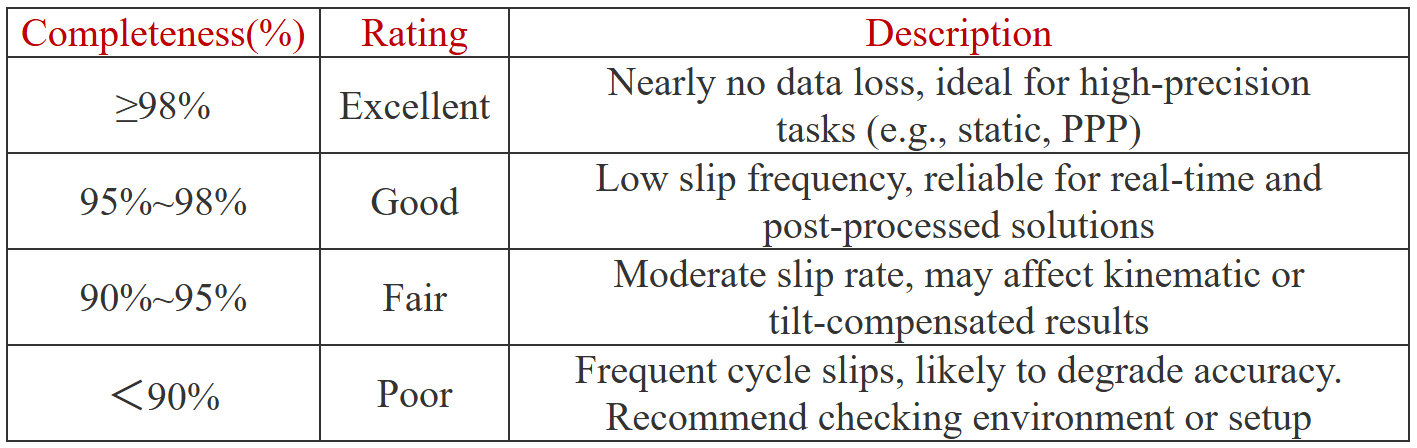
5. Data completeness judgment
Cycle Slip Ratio
1. Definition
The GNSS cycle slip ratio refers to the frequency at which abrupt changes (discontinuities) in the integer number of carrier phase cycles occur in the observation data. It is the ratio of detected cycle slips to the total number of expected observation epochs within a given period. It is used to assess the stability and quality of GNSS measurements.
During GNSS observations, the device measures carrier phase signals from satellites. However, due to signal obstruction, interference, or device operations such as switching between frequencies, sudden jumps in the carrier phase may occur—these are known as cycle slips.
2. Detection Method
1) Polynomial Fitting Method: Detects abnormal changes in carrier phase between epochs by using combined carrier phase and pseudorange observations.
2) Melbourne-Wübbena Combination: Combines pseudorange and carrier phase measurements to eliminate clock errors and identify cycle slips.
3) TurboEdit Algorithm: Combines geometrically independent combination with ionospheric residual method to enhance sensitivity to small cycle slips.
4) Time-Series Smoothing Method: Identifies abrupt anomalies by analyzing the change in observations between consecutive epochs.
Commonly used tools for analyzing cycle slip ratios include TEQC, RTKLIB, GAMP (developed based on BNC), Anubis, as well as customized Python scripts.
3. Key Metrics
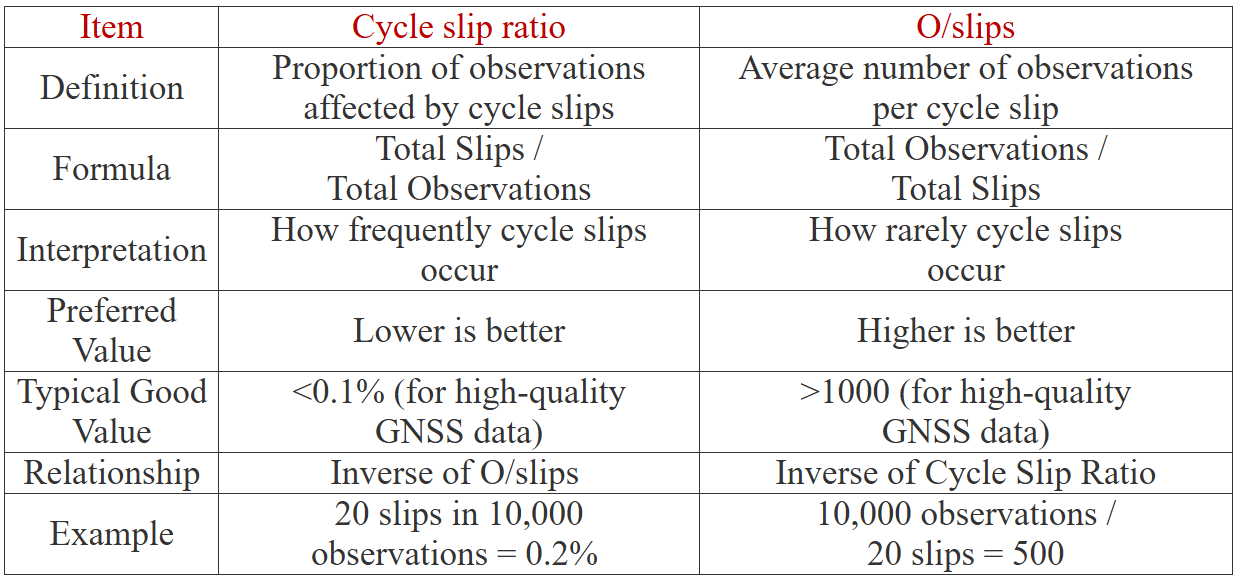
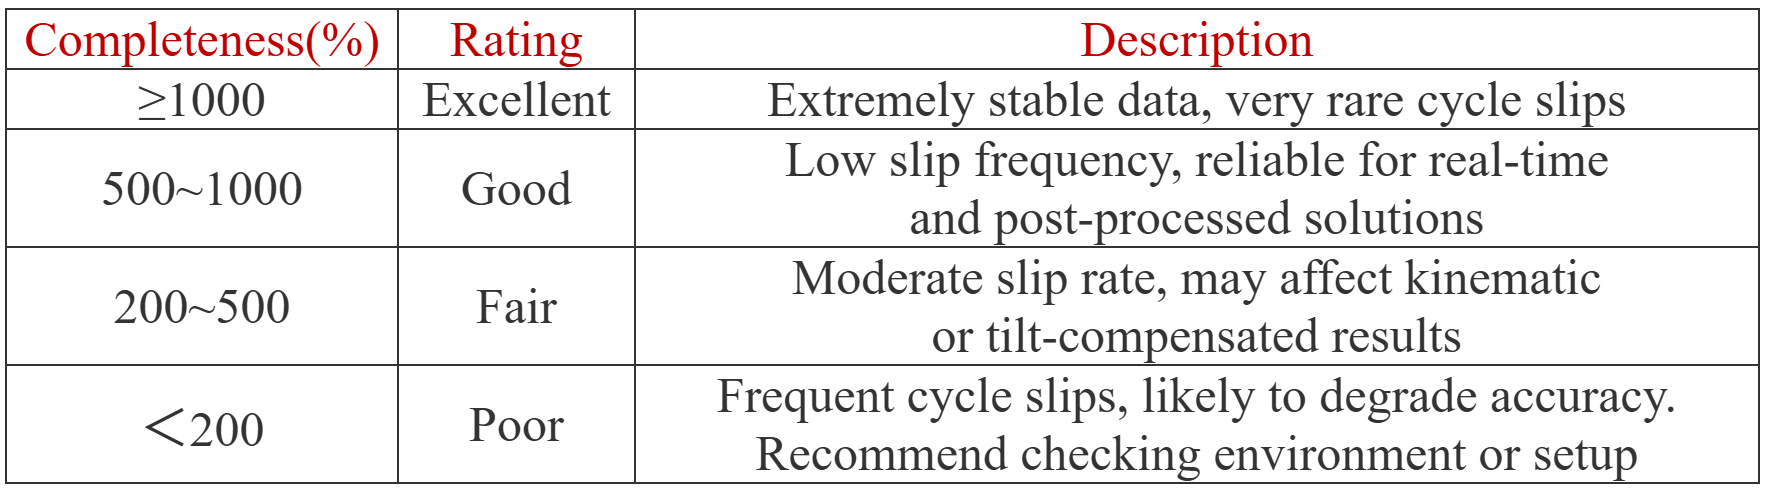
O/slips (Observations per Slip): This metric indicates how many observations occur between each cycle slip. A higher value means fewer cycle slips and better data stability.
Cycle Slip Distribution: Consecutive slips are more problematic than isolated ones, as they may cause GNSS device to lose lock or have strong multipath effects.
Multi-Frequency Comparison: Differences in cycle slip ratios across L1, L2, and L5 frequency bands can help identify potential issues such as ionospheric disturbances or hardware malfunctions.
The Difference Between Cycle Slip Ratio and O/slips
O/slips Judgment
Conclusion
Data completeness and cycle slip ratio are two key indicators for evaluating GNSS data quality.
Data completeness reflects the continuity of observations and is essential for maintaining a stable positioning solution. The cycle slip ratio indicates the stability of carrier-phase measurements—lower values suggest fewer slips and higher data quality.
By combining these two metrics, a comprehensive assessment of raw GNSS data quality can be achieved, helping to identify issues related to the environment or device performance. Whether for CORS base stations or mobile GNSS devices, evaluating data quality using both completeness and cycle slip ratio provides a reliable foundation for monitoring and diagnostics.

